Freedom Sales Hub
Real-time visibility for 500–1000 field reps nationally — plus a bot that caught fake leads before they hit the numbers.
- Role
- UX Designer & Builder
- Client
- National field sales organization
- Timeline
- 6 months
- Impact
- 500–1000 — Field reps tracked in real time
The Problem
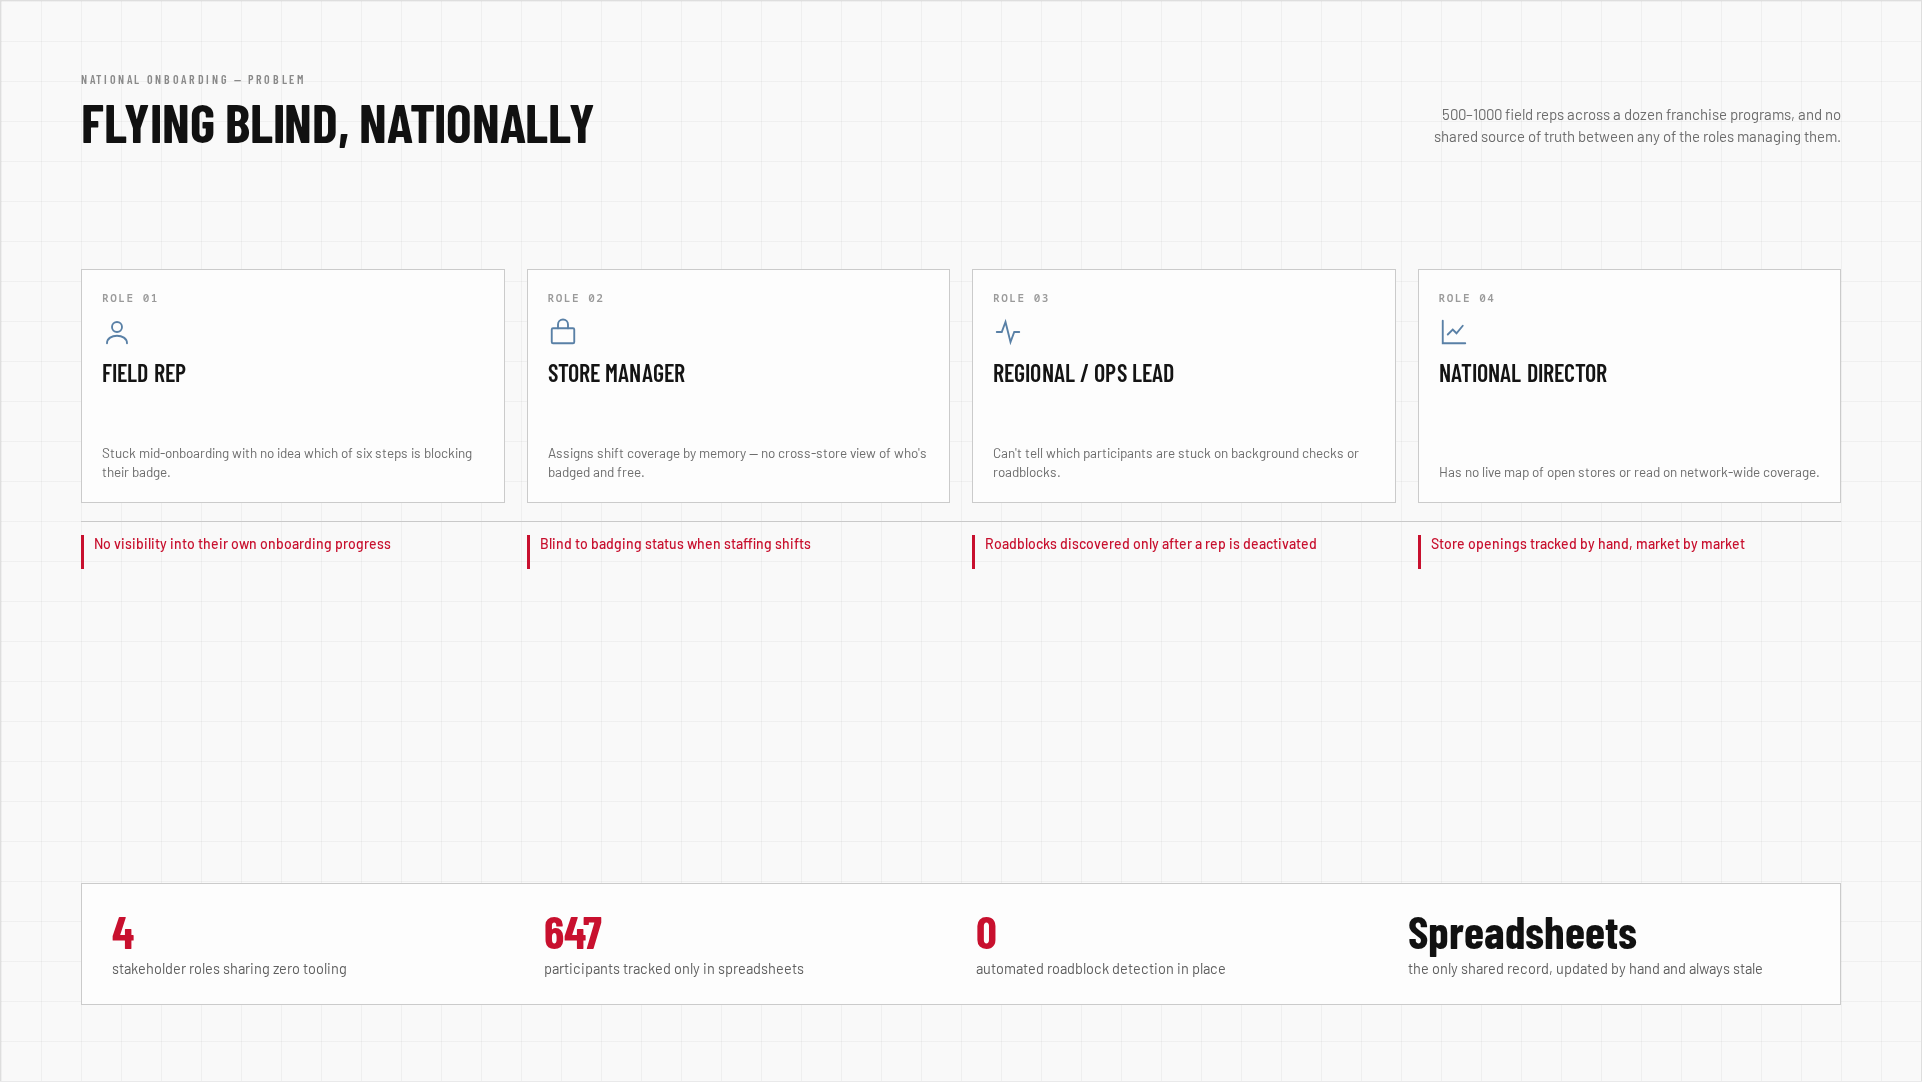
National directors, regional managers, and store managers all making decisions blind.
What I Built
One dataset reshaped into four role-specific views, plus an automated agent to catch fake leads.
The Result
Adopted and well-liked across all 500–1000 reps and every stakeholder level.
Overview
Built for a Home Depot vendor program running field sales reps nationally, supporting 500–1000 reps across the country — a system meant to give every level of the organization, from individual reps to national directors, one shared source of truth.
Problem
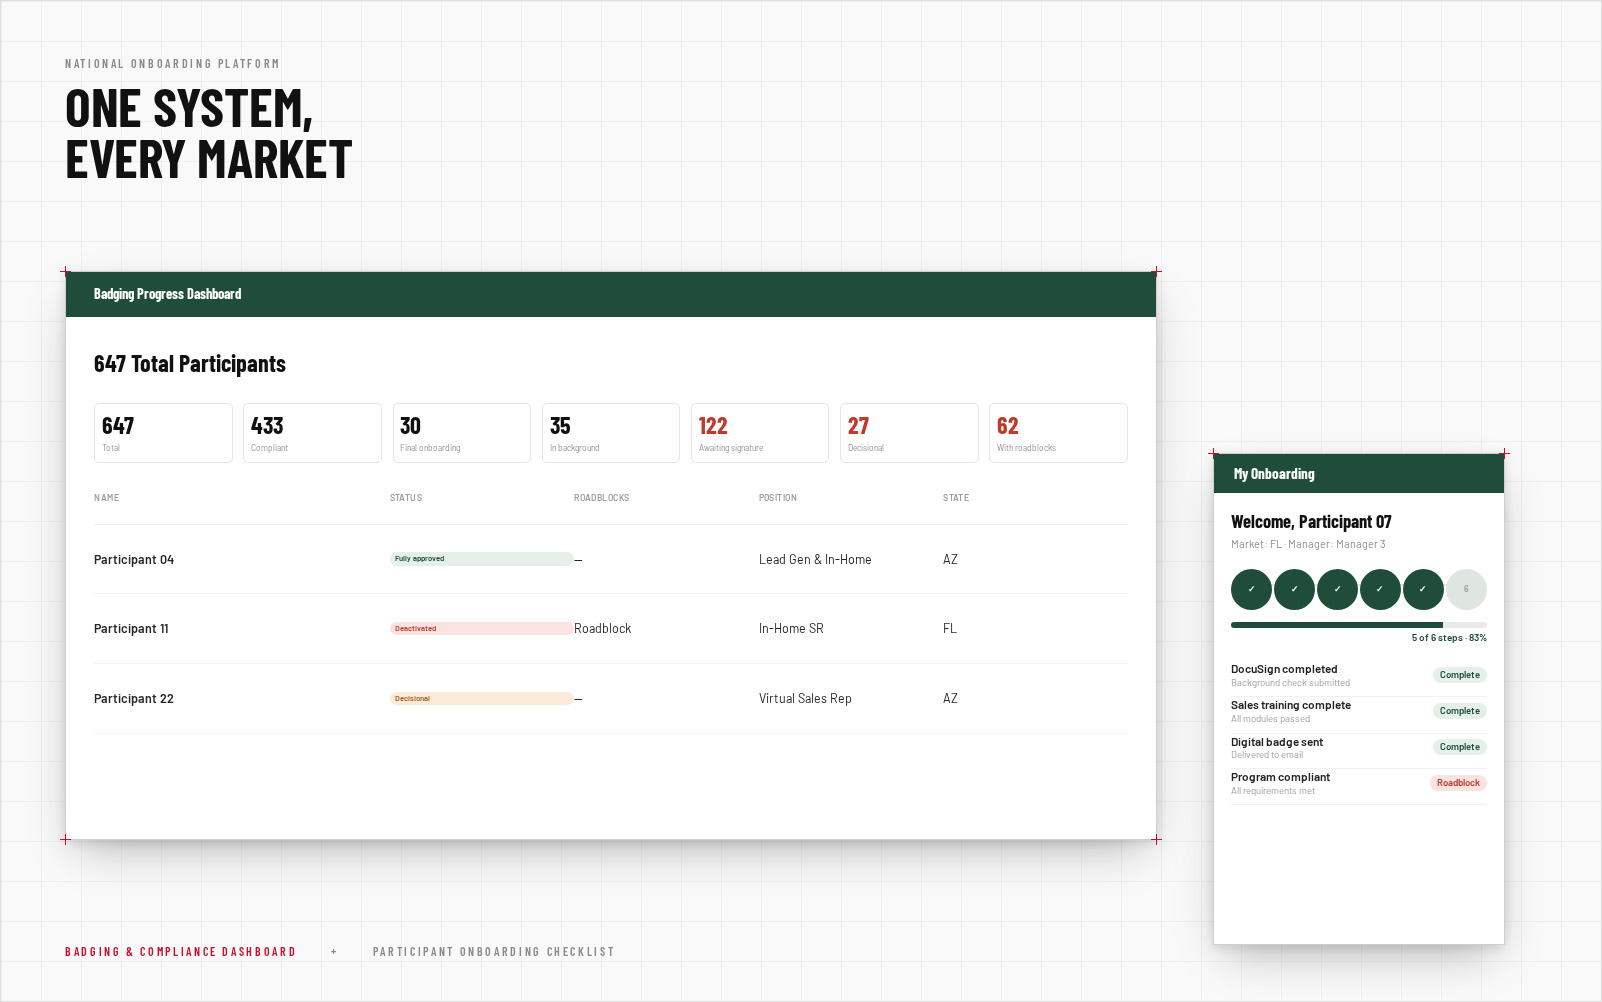
National directors, regional managers, and store managers were all making decisions blind. No real-time data existed on which stores or regions were producing, no visibility into new-hire onboarding progress, and no way to catch bad-faith data entry before it skewed reporting. Onboarding data alone lived split across a spreadsheet roster and a separate internal tracking workbook, each with its own inconsistent status labels and duplicate or flagged entries that had to be manually reconciled before anyone could trust a number.
Process
One Dataset, Four Views
Rather than build one generic dashboard, the system was designed around the fact that each stakeholder needed a different lens on the same underlying data:
Onboarding data originated from a shared spreadsheet fed by remote program coordinators, and a rep's real onboarding progress was mirrored 1:1 into their dashboard status pills — the same underlying data, reshaped for each stakeholder's role rather than a single generic view.

Partner Onboarding
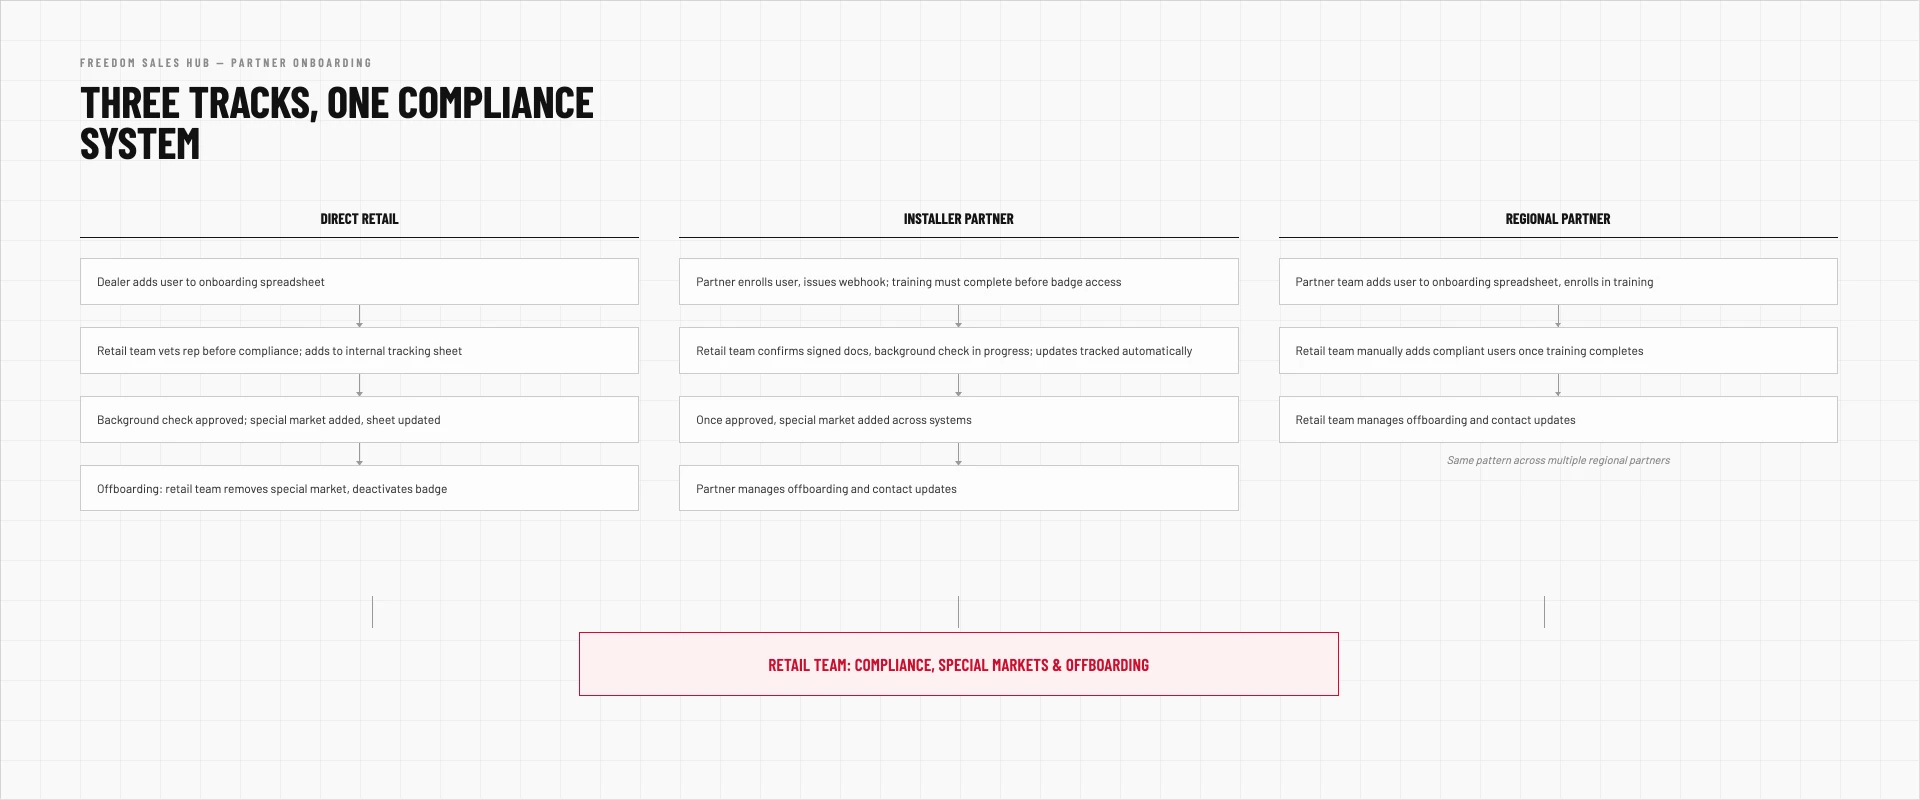
Partner-side onboarding added its own layer of complexity, separate from the reporting-visibility problem. Reps could join through three different tracks — direct retail signup, installer partners, or regional partner programs — each with its own steps for background checks and training. Designing one shared compliance layer to reconcile all three let those very different onboarding paths feed the same trustworthy dataset the four dashboards depended on.
Solution
Lead Integrity Agent
When the national director flagged reps entering fake leads in suspicious bursts to hit quota, I took the initiative to build an automated monitoring agent (using AI-assisted development) to scan the live lead sheet for abnormal entry cadence. Flagged reps surfaced as red alert cards in real time on the program coordinator's lead health dashboard — turning a manual trust problem into a system that caught bad data before it reached leadership reporting.
Interactive Market Maps
Built for national directors to visualize store locations, sales performance, and open territory across the country. Directors could click into individual stores to see basic performance data, and reserve or drop stores directly from the map — updating their store roster live, without needing a separate spreadsheet or manual handoff.
Outcome
Adopted and well-liked across every stakeholder level — reps, store managers, regional managers, and national directors — for translating messy, distributed data into decisions that could be made in real time instead of after the fact. The company later went bankrupt for reasons unrelated to this system, so it is no longer live.

Next project
Urban Athletics
1stTo market with gym-as-clinic in Houston
Read case study